x = f(θ)cosθ
y = f(θ)sinθ
となる。
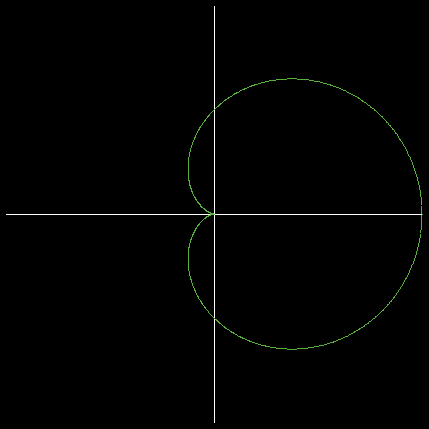
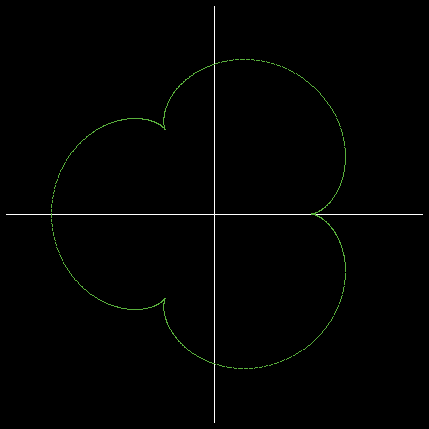
Cardioidは、極座標では r = a(1+cosθ) であるから、 パラメータ表示では
x = a(1+cosθ)cosθ
y = a(1+cosθ)sinθ
となる。
NetLogoでは、リストを返す手続きも作成できるので、a = 1 として、Cardioid で、あるθのときの(x,y)をリストとして返す手続きを
to-report Cardioid [:th] ;; :th はθ
let :val []
set :val fput ( (1 + math.cos :th ) * math.sin :th ) :val ;; y-value
set :val fput ( (1 + math.cos :th ) * math.cos :th ) :val ;; x-value
report :val
end
とできる。
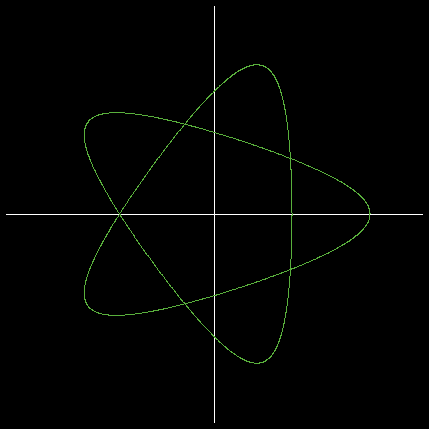
同様に、Cycloid、Nephroid、 Asteroid、 Epitrochoid、 Hypotrochoid のパラメータ表示で、あるθのときの(x,y)をリストとして返す手続きを作成すれば、これらの図形を描くことが可能である。
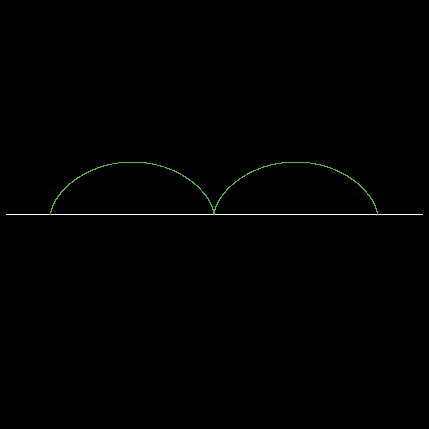
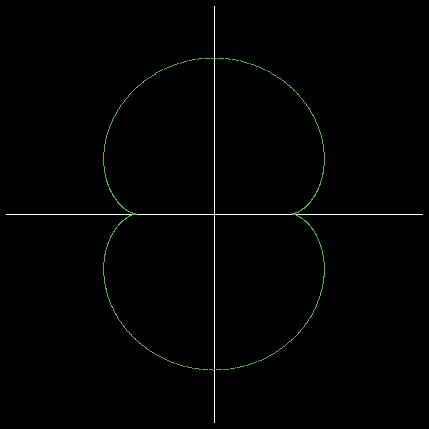
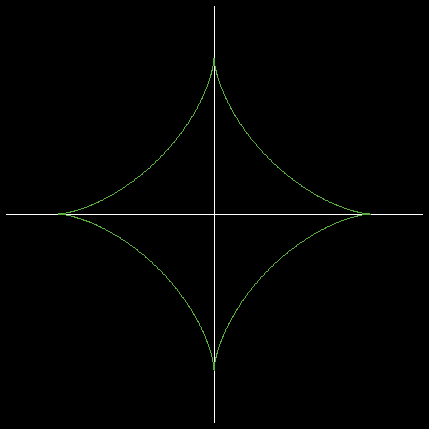
次は、順に Cardioid、Cycloid、Nephroid、 Asteroid、 Epitrochoid、 Hypotrochoid の一例ずつをNetLogoで描かせたものである。
尚、このプログラムのコードはここにあるので、数値を適宜変更すれば、様々な図形を描くことができる筈である。
 哲猫
哲猫